Map 1


Map 2


Map 3


Map 4


Map 5

Map 6
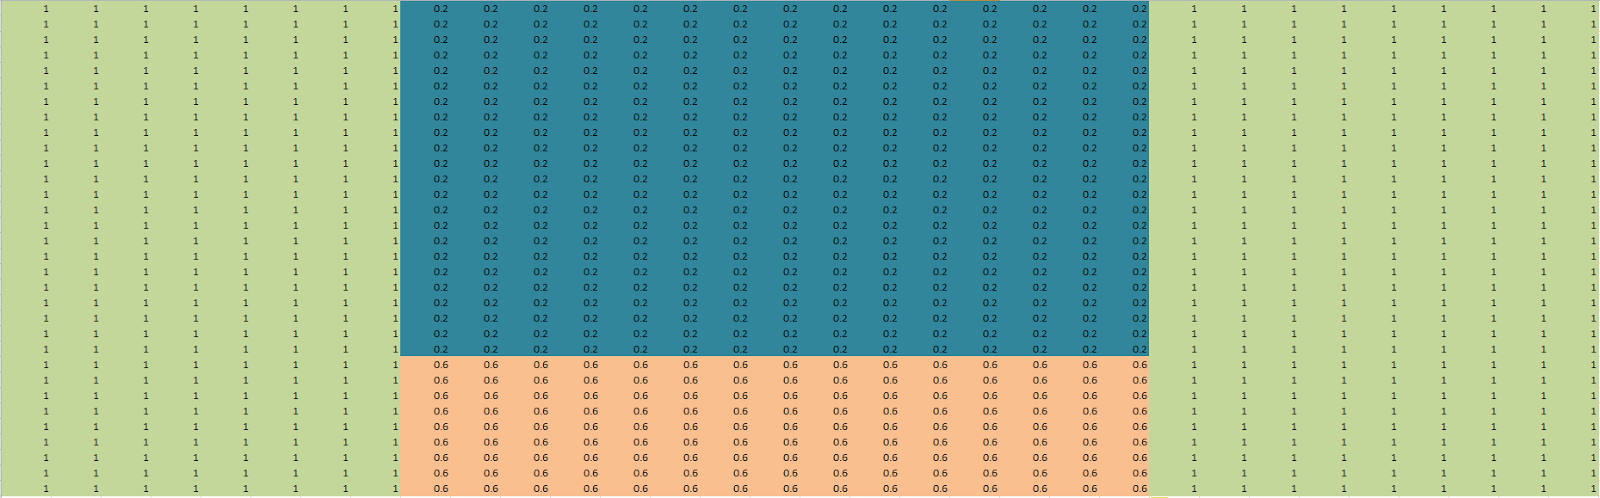

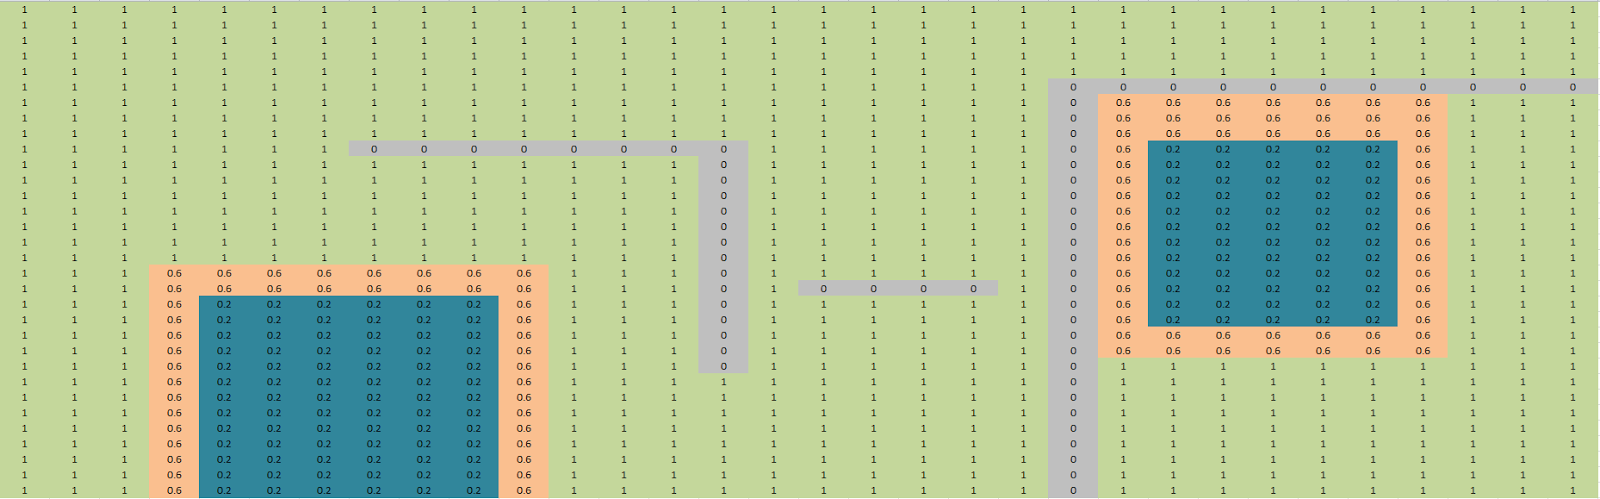
What is interesting here is that the areas in the map with a higher terrain cost are all processed at the same time, after all the areas of lower cost have been processed resulting in our heat maps looking very similar to the actual maps.
This behaviour appears to make sense based upon the way that the Frontier set selection method works. As at each iteration we select all nodes in the queue which have a cost of less than the minimum cost + 1. This means that all the low cost areas will be processed first with high cost areas being processed last as we have shown through the tests and the visualizations.
No comments:
Post a Comment